If you still need convincing that global soccer is not some well-designed professional landscape that functions because of the brilliance of its governing officials but is actually just a barely held together collection of compromises between competing interests that only succeeds because the game itself is so beloved, then I present to you: the September international break.
I’m sorry to all the international soccer-first fans out there, but this stinks. The club season is just kicking into gear, new signings are just starting to get acclimated to their new surroundings and their new teammates — and then it just stops.
Rather than continuing to build cohesion, as you might in, I don’t know, pretty much every other major team sport in the world, each club’s major players fly off to South America or Eastern Europe or Asia to play a couple games in less than a week with a completely different set of teammates and coaches. Some key players inevitably get hurt, and pretty much no one is happy.
From my perspective, the beginning of the season is when I learn the most about each club team — how their new players are being valued, what their new manager wants to do, how good they might be. I come into each season with a blurry projection for each team, and each game makes the picture a tiny bit clearer. But then, of course, the first international break comes, and all I’m left with is a vague impression of everyone, informed by some combination of preseason expectations and a measly three games — 270 minutes — of game time.
But rather than continuing to complain about the bureaucratic inefficiencies that plague the sport I cover for a living, let’s try to wring as much insight as we can from those 270 minutes we all just got to watch. How much will the first three games of the Premier League season tell us about where things might end up after 38 games at the end of the season?
What have the first three Premier League games taught us over the past decade?
Now, there are all kinds of issues with trying to draw any conclusions from what we’ve seen thus far. The biggest one is probably just randomness — teams and players can have three bad or good games in a row, regardless of their underlying talent. Plus, while things like red cards and penalties tend to even out in the long run, a refereeing decision in the first three games will have an outsize impact on a team’s place in the standings.
After that, there’s roster uncertainty and unbalanced schedules. Some teams have key players missing due to injury or because they only recently joined the club, while others have been able to clean up against a weak slate of opponents and a bunch of home matches.
For example, Nottingham Forest have played Bournemouth at home, Southampton away and Wolverhampton Wanderers at home, while Ipswich Town’s first Premier league game in over 20 years was against Liverpool, but at least that was at home. Their second game was away to Manchester City, last season’s champions.
Ale Moreno says a parting of the ways might be the best solution for Liverpool and Trent Alexander-Arnold at the end of the season.
There’s no great way to adjust for all of these factors historically, so instead, we’re just going to ignore them. We’re going to look at the past 10 Premier League seasons and see what statistical markers from a team’s first three games are most predictive of how many points they’ll win by the end of the season.
To do so, we’ll use a statistical concept called R-squared. I’m going to oversimplify, but it’s essentially a number between 0 and 1 that shows how much of the variation between one variable is explained by another variable. For our purposes, we’re looking at end of season points and then testing out a bunch of different numbers. If the R-squared is zero, it means the chosen number has no connection to a team’s end of season point total. If it’s 1, then it would perfectly predict a team’s end of season point total. A number of 0.5 or better is generally viewed as a statistically significant result.
So, we’ll start with points. The R-squared is 0.35, which is better than expected but also maybe not that surprising. Better teams tend to win more points over a random three-game sample — so it’s not completely random — but there are also plenty of bad teams that win a lot of points and good teams that don’t when you just pick off a trio of matches.
I figured non-penalty goal differential would be a slightly better predictor than points. Which team is more likely to be better — the one with a plus-7 goal difference and seven points from three games, or the one with a plus-three goal difference and nine points? Despite that, goal difference from the first three games has the exact same R-squared as points.
Now, for the nerdier stuff. Er, even nerdier stuff. Non-penalty expected-goal difference from the first three games is better than points and goal difference. It’s easy to understand why, too: more data points. Points are just the results of games, while with goals you’re only looking at around seven data points per team. With xG, or expected goals, you’re both accounting for every shot a team attempted and conceded, and then you’re controlling for the quality of the attempt. From just three games, xG is more predictive of future performance than any of the top-line table numbers — but not by that much: an R-squared of 0.37.
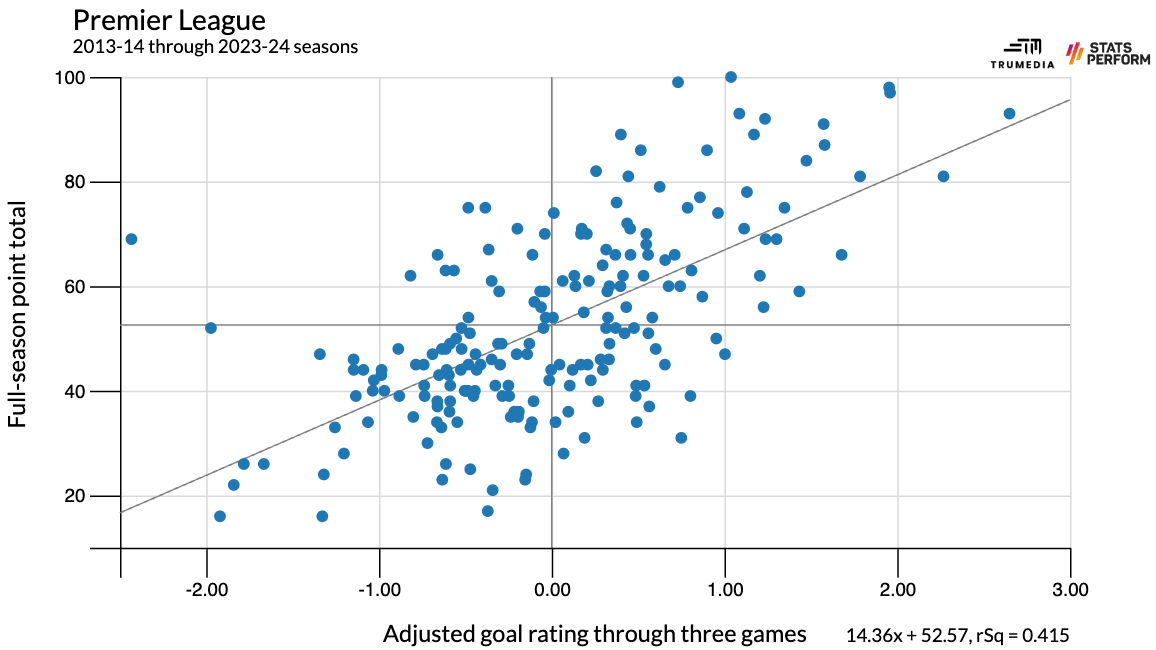
We can do even better than that, though. How? By combining goals and expected goals. I’ve talked about this plenty before, but an adjusted goal difference — one that weights xG at 70% and goals at 30% — is more predictive than pure xG difference. And that’s true even after three games, at an R-squared of 0.42.
It doesn’t hit the 0.5 threshold, but 0.42 is quite high from just three games. Without adjusting for injury or schedule over 10 different seasons, this number explains more than 40% of the variation in the end of season point totals across the Premier League.
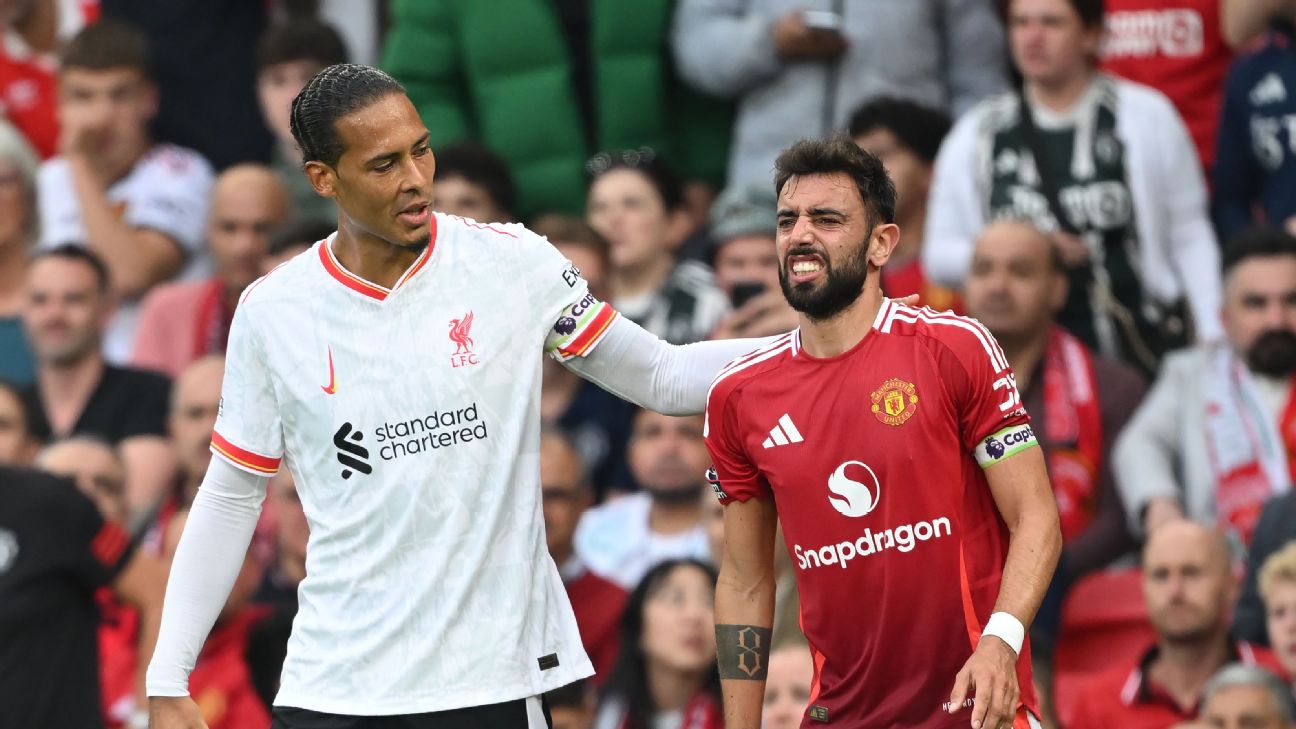
Why might that be? By adding in some weighting for goals, you’re picking up on things that the xG models aren’t capable of counting, like finishing skill, goalkeeping ability or tactics that manage to fool the model into thinking shots are harder or easier than they actually are. You’re also helping to cancel out score effects, i.e. a situation like the Manchester United-Liverpool game:
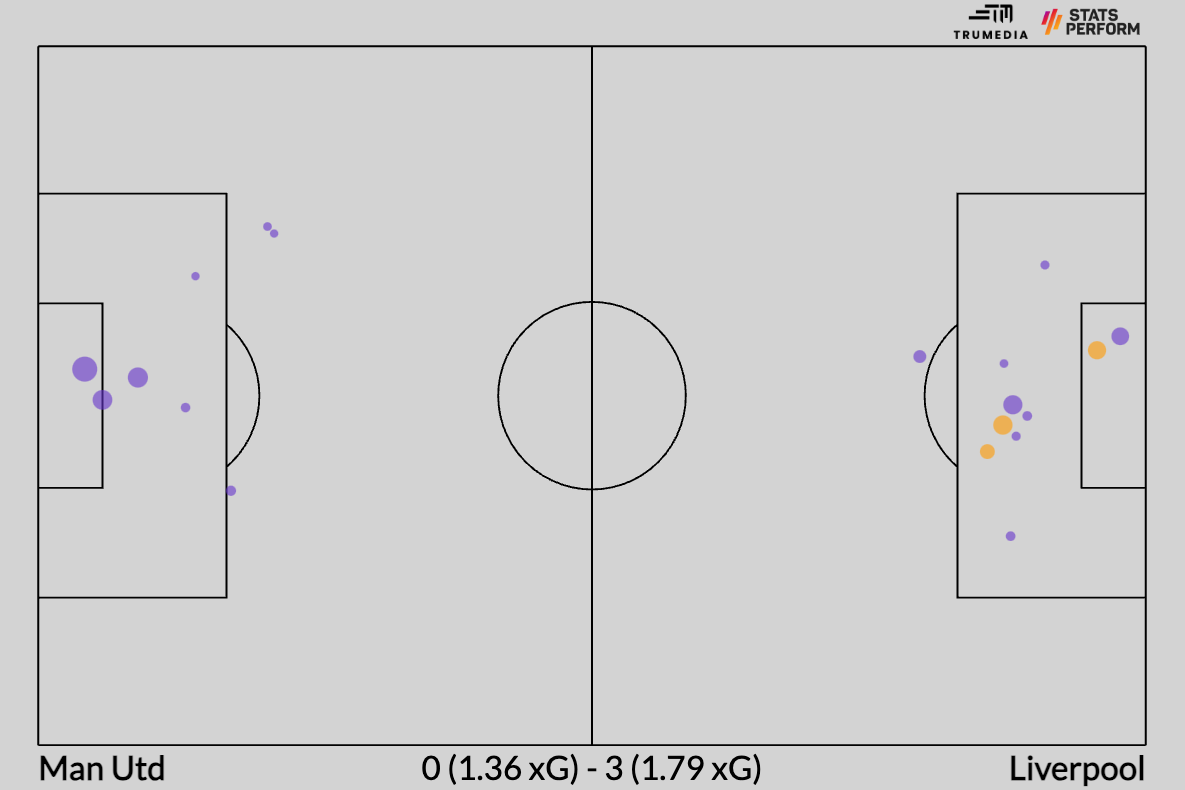
The xG makes it look somewhat close, but all of Manchester United’s quality chances came after Liverpool went up 3-0 and took their feet off the gas. This wasn’t a true 3-0 game — few are because almost every three-goal win requires one team to finish at an unsustainable rate — but if you apply the adjusted numbers to the match (70% xG, 30% goals), we could say that Liverpool outplayed United by about 1.2 goals. That feels right.
OK, so we’ve settled on the best one-number predictor for future performance, but what does it tell us about this current season?
How the first three Premier League games might explain the next 35 games
Here’s how the league stacks up by the adjusted-goal rating through the first three matches of 2024-25:
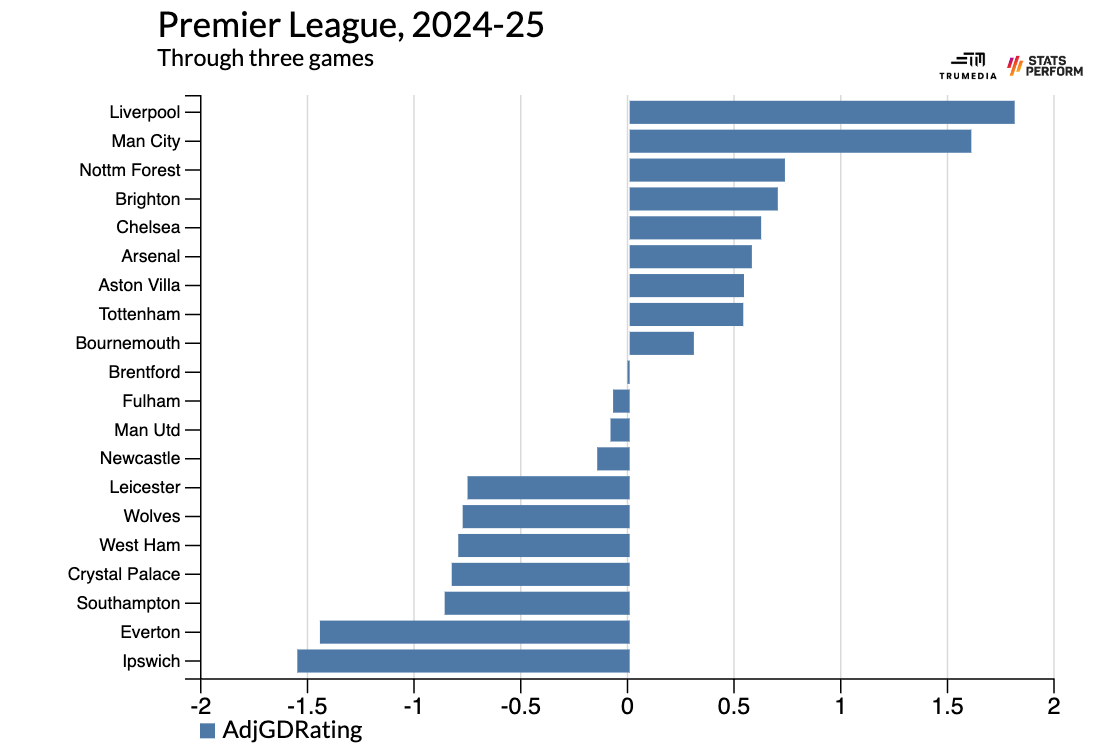
Now that we’ve got a sense of where things stand, let’s roll through the three choke-points in the table: the title race, the top-four race and the relegation race.
Over the past five seasons, the average Premier League title-winner has averaged 91.6 points. We’ll be a little conservative and lower the threshold to 88 points. Among all of the teams to hit 88 points by the end of a season over the past 10 campaigns, their average adjusted goal-rating through the first three games was plus-1.38.
Liverpool and Manchester City are way above that average so far, while everyone else is way below it. So, is it only a two-horse title race? Not quite. Arsenal won 89 points last season, and their adjusted goal rating through three games was plus-0.4. This year, it’s actually somewhat better: plus-0.57.
Based on all of this, it seems reasonable to upgrade Liverpool a bit, keep Man City where they always are and maybe downgrade Arsenal ever so slightly. But I’m not really going to lower my expectations for Arsenal. They’ve had a tough schedule and played a man down for half of the game against Brighton & Hove Albion
Now, let’s look at each team’s adjusted goal rating through the first three games of each of the past 10 seasons, compared to their full season point total. See that one dot all the way to the left? As in, the worst start to a season from any team over the past decade? Yeah, that’s Arsenal in 2021-22, when they ultimately finished fifth, two points out of fourth:
Over the past five seasons, the average fourth-place team has earned 68.6 points. We’ll make the realistic realm of fourth place somewhere between 66 and 71 points. And among teams to finish somewhere in there over the past 10 years, the average adjusted goal rating was plus-0.31.
Among the potential top-four challengers coming into this season, both Manchester United and Newcastle are well below that rate. Meanwhile, projected mid- or lower tablers Brighton and Forest are well above that rate. The other presumed top-four challengers — Chelsea, Tottenham Hotspur and Aston Villa — have all played about as well as we’d expect from teams in contention to be the fourth best in the league.
Both Man United and Newcastle still could finish top four, but these teams were all so bunched up to start the season that I’d slide them both to, at best, the bottom of the top four-chasing pack. Forest have played the easiest schedule in the league so far, so I don’t think they’ll actually be a Champions League-caliber team — but, barring a points deduction for breaching the league’s financial rules, they already seem unlikely to be a relegation candidate, which is an improvement on preseason expectations.
Brighton have benefitted from two red cards thus far, but they came into the season as a high-variance side with lots of young players and a young manager. Putting up this kind of performance against a tough schedule has me thinking they’re more likely to end up on the higher range of their potential outcomes.
As for the bottom of the table, the typical 17th-place team has averaged 37 points over the past five seasons. We’ll use that as a cut-off for the lower end of our range here and put the upper end at 40 points. Over the past 10 seasons, these teams have produced an average adjusted goal rating of minus-0.38.
When looking at this season, none of the promoted teams have been better than that, while West Ham United, Wolves and Crystal Palace have all been well below the average level of the team that just avoids relegation. That seems particularly bad for West Ham and Palace — the former who invested a ton of money into their squad this summer and the latter who were a borderline top-four team after Oliver Glasner took over last season.
Instead, though, I want to look at the worst team that still reached the 37 to 40-point range: 2022-23 Bournemouth, who posted a minus-1.13 adjusted goal rating through their first three games.
At least Ipswich have an excuse for being below that number: They were in League One two seasons ago and their first two games were against Liverpool and Manchester City.
Everton, though? Not so much. There was a red card in their first match, and while those kinds of decisions aren’t necessarily predictive of anything, it’s hard not to see it as a direct result of the club starting 39-year-old left-footer Ashley Young at right back against arguably the best left-winger in the league, Brighton’s Kaoru Mitoma. Play stupid games, win stupid prizes and all that. They then kept all their players on the field for the next two games, and it’s not like matches away to Spurs and home to Bournemouth is some kind of competitive gauntlet. Yet they conceded seven goals across those two games and picked up zero points.
While there is plenty to be gleaned already, there’s not a ton you can confidently declare about a season after only three games. But Everton have been so bad that we’ve already reached the point where we can say this: When a team plays as poorly as Sean Dyche’s side through three games, the most likely outcome is that they’ll start next season in the Championship.
